
Medically reviewed by: Health is Heaven Medical Review Board | Published by Ganesh G Kamble, Health is Heaven | Published: April 22, 2026 · Last updated: August 11, 2026
For decades, blood glucose monitoring was reserved almost exclusively for people already diagnosed with diabetes. A once-yearly fasting blood glucose reading was considered sufficient for everyone else. That paradigm has fundamentally shifted. With the rise of wearable sensors, understanding optimal CGM target ranges for non-diabetics has become a key foundation of preventive health, showing that waiting for a clinical threshold to be crossed is not the same as being metabolically healthy.
A CGM worn for 14 days produces over 2,000 individual glucose readings, compared to the single snapshot of an annual fasting test. It captures postprandial responses to specific foods, overnight glucose patterns, the impact of stress and sleep on metabolic regulation, and the speed of glucose return to baseline after a meal. This data is key to understanding and improving your how to improve metabolic flexibility. For a non-diabetic, this data can reveal early warning patterns of insulin resistance (often co-presenting with early skin signs of insulin resistance), reactive hypoglycemia, and glycemic variability that are clinically invisible on standard lab work.
This guide explains how a CGM works, defines the 7 key glucose metrics to monitor, provides evidence-based clinical targets, and describes the dietary and behavioral inputs that help establish healthy CGM target ranges. For individuals looking to stabilize these glucose metrics, implementing key protocols on how to lower blood sugar naturally fast and learning how to lower fasting insulin levels naturally are vital clinical steps. As always, consult a qualified healthcare provider before initiating CGM-based health protocols (such as referencing our custom healthy recipes for diabetes management), particularly if you have an existing medical condition or are taking medications that affect blood glucose.
Health is Heaven Interactive Tools
Know Your Glucose Risk Before You Start
Use our Blood Sugar Checker to log and interpret your current readings, and the Diabetes Risk Assessment to evaluate your overall metabolic risk profile before starting a CGM protocol.
What Is a Continuous Glucose Monitor and How Does It Work?
A continuous glucose monitor is a wearable medical device that automatically measures glucose levels at regular intervals (typically every 1 to 5 minutes) using a small sensor filament placed subcutaneously in the interstitial fluid, most commonly on the upper arm or abdomen. Unlike a fingerstick test which measures glucose in capillary blood, a CGM measures glucose in the interstitial fluid that bathes cells between blood vessels.
The sensor operates via an electrochemical reaction: glucose in the interstitial fluid reacts with glucose oxidase enzyme coated on the sensor filament, producing a measurable electrical current proportional to glucose concentration. This signal is transmitted wirelessly to a smartphone or dedicated receiver, where software algorithms convert it to a mg/dL or mmol/L reading in real time.
One important characteristic of CGM readings is the physiological lag between interstitial glucose and blood glucose. Because glucose must diffuse from the capillary blood into the interstitial compartment, CGM readings trail behind blood glucose by approximately 10 to 15 minutes. This means a CGM is slightly slower to register a rapid glucose rise after eating than a simultaneous fingerstick would be. For trend monitoring purposes, this lag is clinically insignificant. For acute clinical decisions (dosing insulin, confirming hypoglycemia), a confirmatory fingerstick may be needed. When verifying these fingerstick values, reference standard normal blood sugar levels chart ranges to evaluate your metabolic profile.
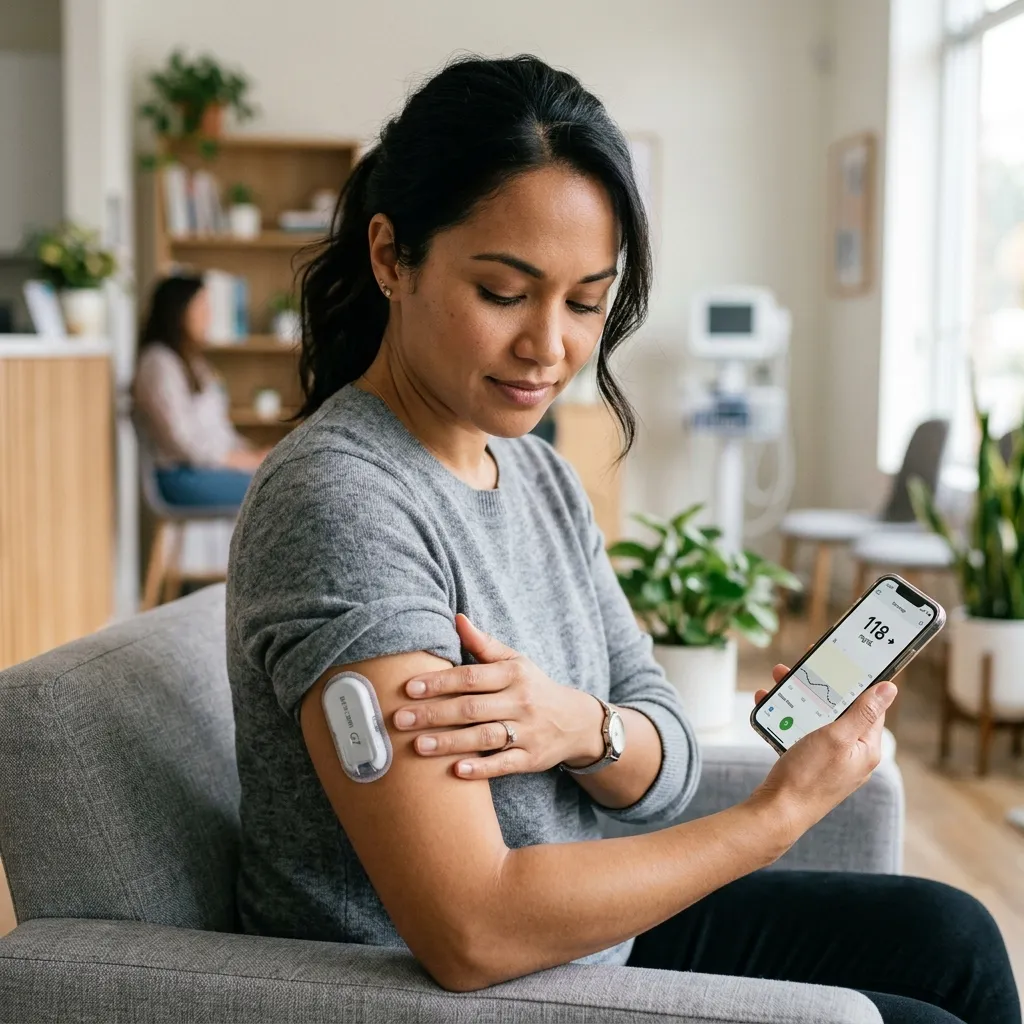
Several CGM devices are now available to non-diabetics without a prescription in many countries:
- Stelo by Dexcom: The first CGM cleared by the FDA specifically for adults without diabetes. Wears for 15 days and provides over-the-counter access without a prescription in the United States.
- Lingo by Abbott: Based on the FreeStyle Libre platform, designed for wellness monitoring in non-diabetics. Available directly to consumers.
- FreeStyle Libre 3 and Dexcom G7: Prescription devices with higher clinical accuracy, often used by non-diabetics who are working with metabolic health physicians or practitioners.
CGM use by non-diabetics has grown substantially in the biohacking and preventive medicine communities. Research published in Nature Metabolism (Zeevi et al., 2015, Weizmann Institute) demonstrated that glucose responses to identical meals vary dramatically between individuals with identical fasting glucose levels, suggesting that population-average dietary guidelines poorly predict individual postprandial responses. This is one of the primary arguments for personalized CGM-guided nutrition in healthy adults. To establish a strong nutritional baseline, reviewing a clinical index of diabetic diet foods to eat and avoid is highly beneficial to identify glycemic-friendly ingredients.
The Spectrum of Glucose Metabolism: From Optimal to Diabetic
Glucose metabolism exists on a continuum, not in binary categories. The clinical classifications used by the ADA (American Diabetes Association) define thresholds for diagnosis and treatment, but they were not designed to identify the full range of metabolic dysfunction that precedes formal disease. Understanding where you fall on this spectrum is the first step to meaningful CGM interpretation.
- Optimal metabolic health: Fasting glucose consistently 70 to 85 mg/dL. Postprandial glucose rarely exceeds 110 to 120 mg/dL. Glucose returns to fasting baseline within 90 to 120 minutes of a meal. HbA1c below 5.2%.
- Normal but non-optimal: Fasting glucose 86 to 99 mg/dL. Postprandial peaks reaching 130 to 139 mg/dL. Glucose may take 2 or more hours to return to baseline after high-carbohydrate meals. HbA1c 5.2 to 5.6%.
- Prediabetes (Impaired Fasting Glucose / Impaired Glucose Tolerance): Fasting glucose 100 to 125 mg/dL, or 2-hour OGTT 140 to 199 mg/dL. HbA1c 5.7 to 6.4%. Postprandial glucose regularly exceeds 140 mg/dL.
- Type 2 Diabetes: Fasting glucose at or above 126 mg/dL on two separate tests, or 2-hour OGTT at or above 200 mg/dL, or HbA1c at or above 6.5%.
Critically, a significant proportion of individuals with normal fasting glucose already have compensatory hyperinsulinemia, meaning their pancreas is producing abnormally high levels of insulin to maintain those apparently normal glucose readings. The pioneering clinical work of Joseph Kraft MD, who conducted insulin assays on over 14,000 patients, documented five distinct insulin secretion pattern types. Patterns 2 through 5 represented progressively abnormal insulin responses despite normal glucose tolerance on standard testing. This work suggests that insulin resistance may be present and measurable up to 10 to 20 years before glucose values cross the prediabetes threshold.
For a non-diabetic using a CGM, this means fasting glucose alone is insufficient. The full pattern of how glucose rises, how high it peaks, and how quickly it returns to baseline provides a far more informative picture of metabolic function.
Optimal CGM Target Ranges for Non-Diabetics: The 7 Key Metrics
1. Time In Range (TIR): The Primary Metric
Time In Range is defined as the percentage of time glucose readings stay within a defined target range over a measurement period, typically 14 days. It has become the leading CGM metric in clinical research, largely replacing simple point-in-time measurements as a reflection of overall glycemic control.
For non-diabetics targeting optimal metabolic health, research and precision medicine practitioners generally recommend aiming for a primary TIR of 70 to 110 mg/dL (3.9 to 6.1 mmol/L) for at least 95% of the 24-hour period to maintain healthy CGM target ranges. The International Consensus on Time in Range (Battelino et al., 2019, published in Diabetes Care) established TIR targets specifically for diabetic populations (the recommended range for Type 1 and Type 2 diabetes is 70 to 180 mg/dL). For healthy adults, the target band is considerably tighter, reflecting the higher metabolic sensitivity of a functioning pancreas when operating within ideal CGM target ranges. Some longevity-focused practitioners set the upper TIR target at 100 mg/dL rather than 110 mg/dL, though this more stringent target is not yet defined by major clinical guidelines.
TIR is a more clinically meaningful metric than average glucose alone because it captures the distribution of glucose values across the day, including nocturnal patterns, early morning variations, and the frequency and depth of postprandial excursions. A 14-day average glucose of 92 mg/dL could result from consistently stable glucose (90% TIR = excellent) or from frequent oscillations between 70 and 120 mg/dL (60% TIR = more concerning).
2. Fasting Glucose Baseline
Fasting glucose (measured after at least 8 hours without caloric intake) represents the minimum daily glucose value and reflects the balance between hepatic glucose output (for details on liver markers, see our hepatic function and fatty liver disease NAFLD guide) (gluconeogenesis and glycogenolysis) and basal insulin suppression of that output.
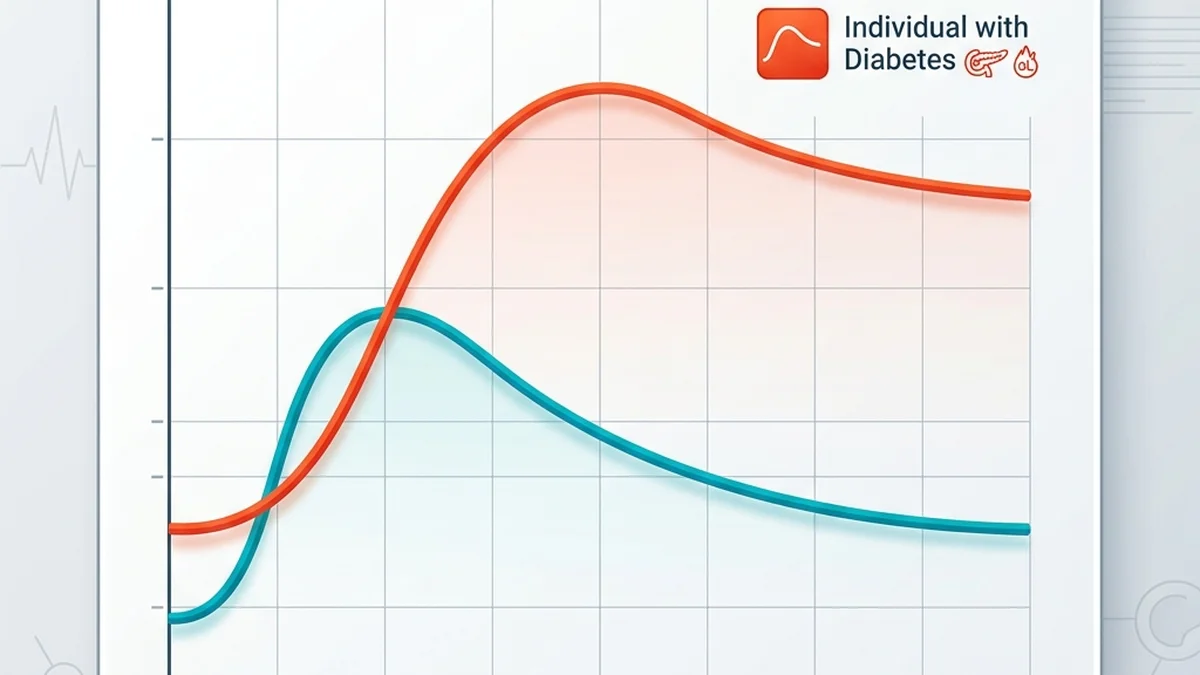
For non-diabetic adults, normal CGM target ranges for fasting glucose include:
- Optimal: 70 to 85 mg/dL. Consistently in this range suggests strong hepatic insulin sensitivity and effective overnight glucose regulation.
- Normal upper limit: Below 100 mg/dL. Values in the 86 to 99 mg/dL range are technically non-diagnostic but some research suggests they are associated with higher cardiovascular risk relative to values in the optimal range.
- Impaired Fasting Glucose (IFG): 100 to 125 mg/dL on two separate measurements. This is the ADA's prediabetes fasting threshold and warrants formal medical evaluation.
Consistently elevated overnight fasting glucose (visible on CGM from approximately 3:00 to 6:00 AM) indicates that readings are rising above the optimal CGM target ranges due to hepatic insulin resistance. The liver normally suppresses glucose output overnight in response to low-level basal insulin. When this suppression fails, the liver continues releasing glucose into the circulation, producing a rising nocturnal fasting baseline. This pattern is closely associated with non-alcoholic fatty liver disease (NAFLD) and represents an early deviation from healthy CGM target ranges detectable on continuous monitoring.
3. Postprandial Glucose Peak
Postprandial glucose is the rise in blood glucose following a meal, driven by intestinal absorption of dietary carbohydrates. The peak typically occurs 45 to 75 minutes after meal initiation (variable depending on meal composition, gastric emptying rate, and individual metabolic rate).
For a metabolically healthy non-diabetic, optimal postprandial CGM target ranges suggest:
- Optimal peak: Below 120 to 130 mg/dL at 60 minutes post-meal
- Acceptable upper limit: Below 140 mg/dL at 1 hour (the ADA's definition of the threshold above which impaired glucose tolerance is considered present during a 2-hour OGTT)
- Return to baseline: Glucose should return to the pre-meal fasting level within 2 to 2.5 hours
Glucose readings consistently above 140 mg/dL post-meal represent excursions outside healthy CGM target ranges that are clinically significant even in non-diabetics. At glucose levels above this threshold, the rate of non-enzymatic glycation of proteins and lipids accelerates, oxidative stress increases through mitochondrial superoxide production, and endothelial function is transiently impaired. Repeated postprandial excursions above healthy CGM target ranges cumulatively contribute to vascular damage and accelerated biological aging.
4. Glycemic Variability: Coefficient of Variation (CV)
Glycemic variability refers to the magnitude of glucose fluctuations throughout the day, independent of mean glucose level. It is quantified most commonly as the Coefficient of Variation (CV), calculated as the standard deviation of glucose readings divided by the mean glucose, expressed as a percentage.
A CV below 36% is considered optimal even for patients with Type 1 diabetes (Battelino et al., Diabetes Care, 2019). For non-diabetics, keeping CV low is essential for maintaining stable CGM target ranges. High glycemic variability is associated with increased oxidative stress through the formation of reactive oxygen species (ROS) during rapid glucose excursions outside optimal CGM target ranges. A study published in Cardiovascular Diabetology showed that high intraday glucose variability predicted carotid intima-media thickness progression (an early marker of atherosclerosis) even in individuals whose mean glucose values were within normal CGM target ranges.
Additional variability metrics available on modern CGM software include MAGE (Mean Amplitude of Glycemic Excursions), which specifically quantifies excursions greater than 1 standard deviation from the mean glucose, and the Glucose Management Indicator (GMI), which provides an estimated HbA1c equivalent from 14-day average CGM glucose data.
5. Time Below Range (TBR): Preventing Reactive Hypoglycemia
Time Below Range measures the proportion of time glucose falls below 70 mg/dL (3.9 mmol/L), the clinical threshold for hypoglycemia. Non-diabetics who do not take insulin or sulfonylureas rarely experience spontaneous hypoglycemia, but reactive hypoglycemia (postprandial hypoglycemia) is more common than generally recognized.
Reactive hypoglycemia occurs when a large postprandial insulin response overshoots the carbohydrate load, driving glucose down below the lower boundary of CGM target ranges (70 mg/dL) approximately 1.5 to 3 hours after a high-glycemic meal. Symptoms include shakiness, sweating, palpitations, and intense carbohydrate cravings. From a physiological standpoint, this hypoglycemic dip below normal CGM target ranges activates the hypothalamic-pituitary-adrenal (HPA) axis, triggering a cortisol and glucagon release that re-raises glucose but leaves the individual in a temporarily activated stress state.
For non-diabetic CGM users, the target should be less than 1% of time below 70 mg/dL. Recurrent TBR events despite not taking glucose-lowering medications warrant evaluation for insulinoma, reactive hypoglycemia syndrome, or post-bariatric surgery dumping syndrome.
Dr. Casey Means (co-founder, Levels Health) and Dr. Andrew Huberman (Stanford Neuroscience) on how to interpret CGM data and use glucose monitoring to optimize metabolic health in non-diabetics.
6. The Dawn Phenomenon and Nocturnal Glucose Patterns
The dawn phenomenon describes a natural early-morning rise in blood glucose, typically beginning between 3:00 and 5:00 AM and reaching a peak by 6:00 to 8:00 AM. It is driven by the coordinated action of counter-regulatory hormones: growth hormone (released during deep NREM sleep), cortisol (rising as part of the Cortisol Awakening Response, which you can optimize using our guide on how to stop a morning cortisol spike naturally), and glucagon. These hormones stimulate hepatic glucose output (for details on liver markers, see our hepatic function and fatty liver disease NAFLD guide) to provide fuel for the expected morning activity period.
For a metabolically healthy non-diabetic, the dawn phenomenon results in a modest glucose rise from approximately 75 to 85 mg/dL up to 90 to 100 mg/dL by waking time, which remains well within normal CGM target ranges. A well-functioning insulin secretory system quickly normalizes this rise after awakening. On a CGM, this appears as a gradual upward slope from approximately 3:00 AM that plateaus and then begins declining, keeping overall levels within healthy CGM target ranges by mid-morning.
An exaggerated dawn phenomenon, where fasting glucose consistently registers above 100 mg/dL on the CGM before the first meal, signals that the liver's counter-regulatory response is not being adequately suppressed. This is closely associated with hepatic insulin resistance and often precedes or coincides with non-alcoholic fatty liver disease (NAFLD). A separate pattern, the Somogyi effect, involves nocturnal hypoglycemia followed by a rebound hyperglycemia from counter-regulatory hormone release. On a CGM trace, this appears as a glucose dip below 70 mg/dL between midnight and 3:00 AM followed by a sharp morning rise. The Somogyi effect in non-diabetics is uncommon but may occur in individuals with reactive hypoglycemia tendencies.
7. Average Glucose and Estimated HbA1c (GMI)
The Glucose Management Indicator (GMI) is a formula that converts 14-day CGM average glucose into an estimated HbA1c equivalent. It was developed because CGM average glucose and laboratory HbA1c do not always correlate precisely (HbA1c is affected by red blood cell lifespan, variants in hemoglobin, and other factors). The GMI formula is: GMI (%) = 3.31 + 0.02392 x mean glucose (mg/dL).
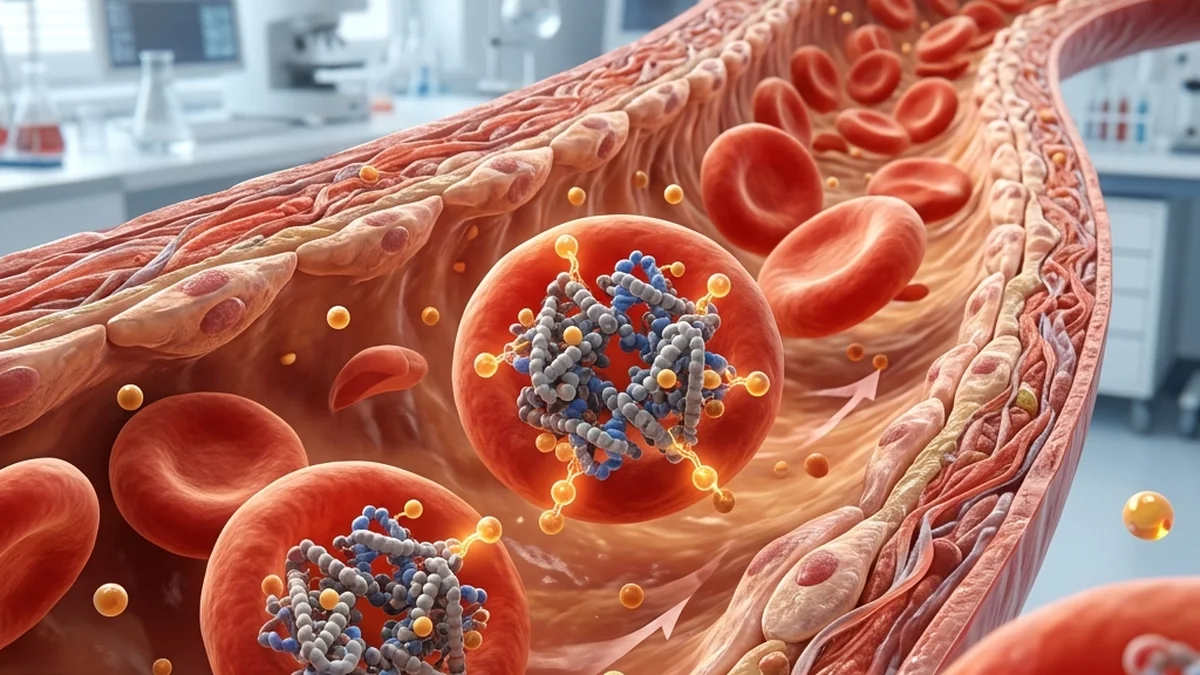
Standard clinical reference values for HbA1c and their GMI equivalents relative to CGM target ranges:
- Below 5.2% (optimal, precision medicine target): Equivalent CGM average of approximately 103 mg/dL or lower
- 5.2 to 5.6% (normal, above optimal): CGM average approximately 103 to 114 mg/dL
- 5.7 to 6.4% (prediabetes range): CGM average approximately 117 to 137 mg/dL; requires physician evaluation
- 6.5% or above (diabetes range): Formal diabetes evaluation and management required
For non-diabetics using a CGM for optimization purposes, targeting a 14-day average glucose below 100 mg/dL (GMI approximately 5.7% or below) with a consistent TIR above 95% in the 70 to 110 mg/dL range represents a pragmatic, evidence-informed set of CGM target ranges for long-term metabolic health preservation. Specific personal CGM target ranges should always be determined in partnership with a healthcare provider.
The Cellular Mechanism: Why Postprandial Glucose Spikes Cause Harm
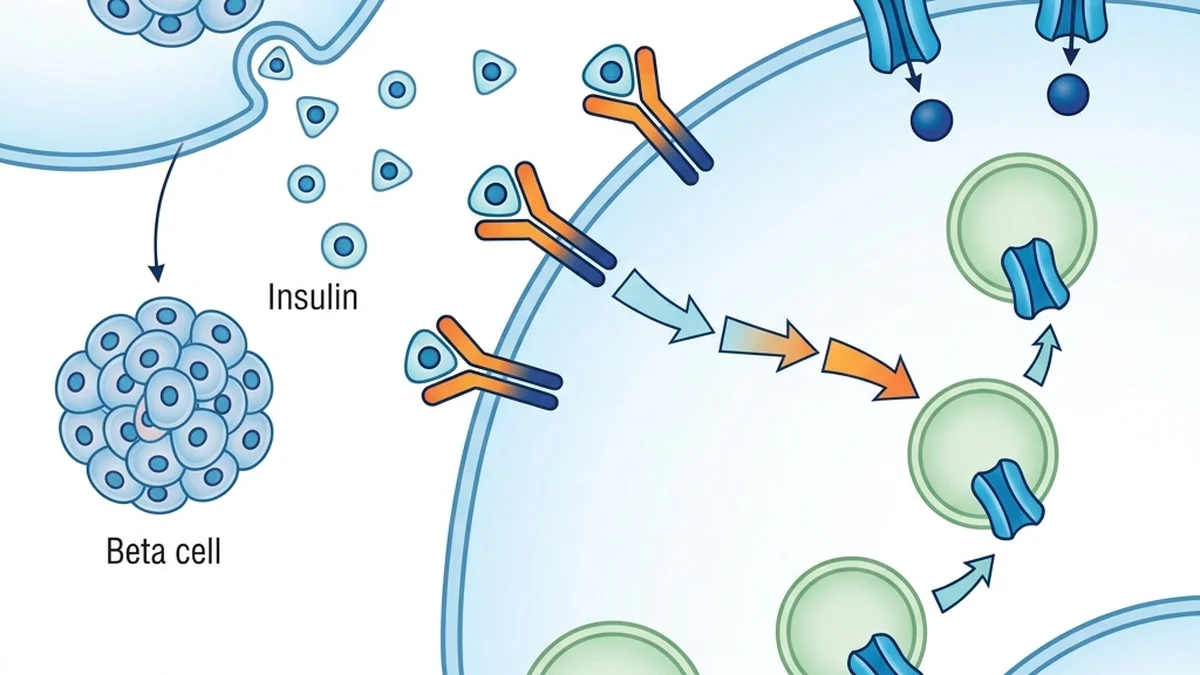
Understanding why postprandial glucose spikes matter mechanistically provides the clinical rationale for establishing optimal CGM target ranges. Three converging pathways explain the cellular damage associated with glucose excursions above 140 mg/dL:
Non-enzymatic glycation and AGE formation. When glucose concentration rises above approximately 140 mg/dL, which is outside recommended CGM target ranges, the rate of Maillard reaction chemistry (non-enzymatic binding of glucose to proteins and lipids) increases substantially. Glucose attaches covalently to free amino groups on hemoglobin (forming HbA1c), collagen fibers (reducing vascular elasticity), apolipoprotein B on LDL particles, and lens proteins in the eye. Over time, these glycated products are further oxidized and cross-linked to form advanced glycation end products (AGEs). AGEs bind to RAGE receptors on endothelial cells, smooth muscle cells, and macrophages, triggering NF-kB-mediated inflammatory cascades and reactive oxygen species (ROS) generation that disrupt healthy CGM target ranges.
Mitochondrial oxidative stress. Postprandial hyperglycemia drives excessive electron flux through the mitochondrial electron transport chain. When the concentration of glucose-derived NADH overwhelms Complex I and III, electrons leak to molecular oxygen, forming superoxide radicals. This excess superoxide inhibits glyceraldehyde phosphate dehydrogenase (GAPDH), a key glycolytic enzyme, and redirects glucose through damaging side pathways including the polyol pathway, hexosamine pathway, and diacylglycerol-PKC activation. Research from the laboratory of Michael Brownlee at Albert Einstein College of Medicine established this mitochondrial superoxide overproduction as the central unifying mechanism of hyperglycemia-induced vascular damage.
Endothelial nitric oxide synthase (eNOS) uncoupling. Healthy endothelial function depends on eNOS producing nitric oxide (NO), which dilates blood vessels, reduces platelet aggregation, and prevents LDL oxidation. Glucose-induced superoxide rapidly scavenges NO, reducing bioavailable nitric oxide. Simultaneously, oxidative stress uncouples eNOS, causing it to produce superoxide rather than NO. Even a single meal causing a glucose excursion above 140 mg/dL (outside optimal CGM target ranges) produces measurable endothelial dysfunction detectable by flow-mediated dilation (FMD) studies within 2 hours of the meal, showing the cellular impact of crossing these CGM target ranges.
Dietary and Behavioral Inputs That Move Your CGM Numbers
Carbohydrate Source and Glycemic Load
The single most powerful dietary lever for controlling postprandial glucose and maintaining healthy CGM target ranges is reducing dietary glycemic load (GL), the product of a food's glycemic index and the amount of carbohydrate consumed. Ultra-processed carbohydrates produce rapid and high postprandial glucose spikes outside optimal CGM target ranges. Intact whole-food carbohydrates with intact fiber matrices (legumes, whole grains, vegetables) produce slower, lower glucose rises, helping keep readings within recommended CGM target ranges.
The concept of resistant starch is particularly relevant for maintaining stable CGM target ranges. Resistant starch (RS2 in raw potato starch, RS3 in cooked-then-cooled rice or pasta) passes undigested through the small intestine to the colon, where it serves as prebiotic substrate. Higher dietary resistant starch intake is associated with improved postprandial glucose responses and helps preserve fasting values within optimal CGM target ranges.
Meal Sequencing: Vegetables and Protein Before Carbohydrates
A highly practical and evidence-based strategy for reducing postprandial glucose spikes is changing the order in which foods are consumed within a meal. Research by Dr. Alpana Shukla and colleagues at Weill Cornell Medicine, published in Diabetes Care (2015 and 2017), found that eating vegetables and protein sources (such as those from our high protein vegetarian foods list) first, followed by carbohydrates last, reduced the postprandial glucose area under the curve by 29 to 37% compared to consuming carbohydrates first, helping maintain target values within optimal CGM target ranges.
The mechanism involves multiple pathways: the physical presence of fiber and protein in the stomach and small intestine slows gastric emptying, stimulates the secretion of GLP-1 (glucagon-like peptide 1) and PYY from intestinal L-cells before carbohydrate absorption begins, and pre-amplifies the first-phase insulin response. GLP-1 in particular slows gastric emptying and enhances glucose-stimulated insulin secretion from beta cells, effectively priming the system before the carbohydrate load arrives. This is the natural dietary version of the GLP-1 receptor agonist mechanism that makes drugs like semaglutide so effective.
Post-Meal Walking: The Most Effective Glucose Disposal Protocol
A 10-minute walk after meals consistently ranks among the most effective non-pharmacological interventions, showcasing the acute health benefits of walking 30 minutes a day on postprandial glucose disposal. for remaining within healthy CGM target ranges. Skeletal muscle contraction during walking activates AMP-activated protein kinase (AMPK), which triggers insulin-independent translocation of GLUT4 glucose transporters to the skeletal muscle cell surface. This bypasses the standard insulin receptor phosphorylation cascade, creating an alternative glucose disposal pathway to stay within optimal CGM target ranges.
A study published in Diabetes Care (2013, van Dijk JW et al.) found that 45 minutes of moderate-intensity exercise in the postprandial period significantly attenuated the glucose and insulin responses to a high-GI meal. More practically applicable data from DiabetesCare and subsequent wearable-device studies have shown that even a 10-minute walk at a comfortable pace within 30 minutes of meal completion reduces 2-hour postprandial glucose by an average of 15 to 20% compared to remaining sedentary. On a CGM trace, this appears as a flattening of the postprandial curve and a more rapid return to the pre-meal baseline.
Sleep Quality and Morning Glucose: The Upstream Connection
The quality of the preceding night's sleep substantially affects the following day's glucose regulation and ability to maintain healthy CGM target ranges. Sleep deprivation reduces insulin sensitivity in skeletal muscle and hepatic tissues via multiple mechanisms including elevated morning cortisol and growth hormone. Even partial sleep restriction (5 to 6 hours versus 7 to 8 hours) has been shown in controlled studies to increase postprandial glucose responses, making it harder to stay within optimal CGM target ranges. Use the Sleep Debt Calculator to track whether sleep debt is driving readings outside target ranges.
Dr. Robert Lustig (UCSF) on the biochemistry of fructose metabolism, hepatic glucose processing, and the mechanisms linking dietary sugar to insulin resistance and metabolic disease.
Interpreting CGM Patterns: A Practical Reference
Raw CGM data becomes clinically useful when interpreted as patterns relative to established CGM target ranges. The following table maps common patterns to clinical significance to help align your readings with healthy CGM target ranges:
| CGM Pattern | Clinical Significance | Primary Action |
|---|---|---|
| Flat stable trace, fasting 70-85, peaks below 120 mg/dL | Excellent metabolic flexibility and insulin sensitivity | Maintain current diet, sleep, and movement patterns |
| Peaks to 130-139 mg/dL, returns to baseline by 2 hours | Normal response to higher-GI meals; insulin secretory capacity intact | Consider glycemic load reduction for consistently spiking meals |
| Consistent peaks above 140 mg/dL, slow 2.5+ hour return | Postprandial glucose intolerance; potential early insulin resistance | Implement meal sequencing, post-meal walking; consult a physician |
| Fasting glucose consistently 90-99 mg/dL before first meal | Suboptimal fasting baseline; may indicate early hepatic insulin resistance | Address diet quality, sleep debt, visceral fat; discuss with physician |
| Glucose dipping below 70 mg/dL 1.5-3 hours post-meal | Reactive hypoglycemia; exaggerated postprandial insulin response | Reduce meal glycemic load; evaluate with a physician if recurrent |
| High nocturnal glucose 100-115 mg/dL during sleep, before waking | Excessive hepatic glucose output (for details on liver markers, see our hepatic function and fatty liver disease NAFLD guide); strong indicator of hepatic insulin resistance | Assess for NAFLD; reduce dietary fructose and refined carbohydrates; consult a physician |
Using the Health is Heaven Tools to Act on Your CGM Data
CGM data is most powerful when combined with validated tools to contextualize your readings within recommended CGM target ranges. Health is Heaven provides two calculators to help evaluate your values relative to these CGM target ranges:
The free blood sugar checker allows you to log fasting, pre-meal, post-meal, and bedtime glucose readings and receive interpretation guidance calibrated to your specific reading context. Unlike a CGM which provides raw data, the Blood Sugar Checker flags readings relative to clinical reference ranges and explains what each value may indicate about your glucose metabolism status.
The diabetes risk assessment tool evaluates your overall type 2 diabetes risk based on established risk factors including age, BMI, family history, physical activity level, and blood pressure. If your CGM is consistently showing patterns outside recommended CGM target ranges (the yellow or orange zones in the table above), completing the Diabetes Risk Assessment will help you quantify whether a formal medical evaluation is warranted. A high-risk score combined with deviations from optimal CGM target ranges is a clear signal to discuss evaluation with a physician.
When to Consult a Healthcare Professional
CGM monitoring provides valuable self-knowledge, but it does not replace clinical evaluation. Seek professional assessment if you observe consistent deviations from recommended CGM target ranges or any of the following:
- Fasting glucose consistently at or above 100 mg/dL on 14-day CGM average
- Postprandial glucose regularly exceeding 180 mg/dL after typical meals
- Any glucose reading below 55 mg/dL, which may indicate a significant hypoglycemic event requiring investigation
- Nocturnal glucose consistently above 110 mg/dL during sleep despite no recent food intake
- HbA1c result at or above 5.7% on laboratory testing
- Family history of Type 2 diabetes combined with overweight, physical inactivity, or high waist circumference
- Symptoms of hyperglycemia: persistent thirst, frequent urination, unexplained fatigue, or blurred vision
- Symptoms of recurrent hypoglycemia: shakiness, palpitations, brain fog 1 to 3 hours after meals on a regular basis
Diagnostic tests used to formally evaluate glucose metabolism include fasting plasma glucose (FPG), 2-hour oral glucose tolerance test (OGTT), HbA1c, and fasting insulin (for HOMA-IR calculation, which quantifies insulin resistance). CGM data can be shared with your physician to enrich this evaluation with pattern data not captured by point-in-time tests.
Frequently Asked Questions
What is the ideal CGM target ranges for a healthy non-diabetic?
For a metabolically healthy non-diabetic adult, optimal CGM target ranges include a fasting glucose of 70 to 85 mg/dL, postprandial peaks below 120 to 130 mg/dL returning to baseline within 2 hours, and Time In Range (70 to 110 mg/dL) exceeding 95% of the day. These CGM target ranges are more stringent than the clinical prediabetes thresholds and reflect a proactive approach to long-term metabolic health. Individual CGM target ranges should be discussed with a healthcare provider.
Should healthy people without diabetes wear a CGM?
CGM use by non-diabetics has grown with the availability of over-the-counter sensors. The primary benefit is identifying food-specific postprandial responses and recognizing early glycemic variability patterns outside healthy CGM target ranges before clinical thresholds are crossed. Research published in Nature Metabolism has shown highly individual glucose responses to identical meals even among healthy adults. However, tracking CGM target ranges can create unnecessary health anxiety in some individuals, and clinical utility for otherwise low-risk healthy adults remains debated. Consult a physician to determine if monitoring CGM target ranges is appropriate for your context.
What does it mean if my glucose spikes to 150 mg/dL after a meal?
A postprandial peak of 150 mg/dL is above the 140 mg/dL threshold associated with impaired glucose tolerance and suggests a significant glycemic load, representing an excursion outside healthy CGM target ranges. Occasional peaks after unusually large high-GI meals may occur in otherwise healthy individuals, but recurrent spikes above healthy CGM target ranges warrant attention. Meal sequencing, reducing refined carbohydrate intake, and a post-meal walk can help maintain recommended CGM target ranges. Persistent patterns above these ranges should be discussed with a physician.
How accurate are CGM readings compared to fingerstick blood tests?
CGMs measure glucose in interstitial fluid with a 10 to 15 minute physiological lag behind blood glucose. Modern devices (Dexcom G7, FreeStyle Libre 3) report a Mean Absolute Relative Difference (MARD) of approximately 8 to 9% when evaluating CGM target ranges. Accuracy can be affected by sensor site, movement, temperature extremes, and compression. CGM provides valuable trend data relative to your CGM target ranges, but clinical decisions should not be based on a single CGM reading when precision matters.
What is the difference between prediabetes and insulin resistance on a CGM?
Prediabetes is a clinical diagnosis defined by fasting glucose of 100 to 125 mg/dL, 2-hour OGTT of 140 to 199 mg/dL, or HbA1c of 5.7 to 6.4%. Insulin resistance is a physiological state that often precedes prediabetes by years. In early insulin resistance, the pancreas compensates with higher insulin output to maintain normal glucose, so fasting glucose may still appear normal below 100 mg/dL. A CGM can detect early insulin resistance indirectly through elevated postprandial peaks and slow glucose return to baseline, indicating a shift away from optimal CGM target ranges. Formal testing requires a fasting insulin level or HOMA-IR calculation, not just tracking CGM target ranges.
Scientific References
- Battelino T et al. (2019). Clinical targets for continuous glucose monitoring data interpretation: Recommendations from the international consensus on time in range. Diabetes Care, 42(8), 1593-1603.
- Zeevi D et al. (2015). Personalized nutrition by prediction of glycemic responses. Cell, 163(5), 1079-1094. (Weizmann Institute / Segal lab)
- Shukla AP et al. (2017). Food order has a significant impact on postprandial glucose and insulin levels. Diabetes Care, 40(7), e106-e107. (Weill Cornell Medicine)
- Brownlee M (2001). Biochemistry and molecular cell biology of diabetic complications. Nature, 414, 813-820.
- American Diabetes Association (2026). Standards of Medical Care in Diabetes - Classification and Diagnosis. Diabetes Care, 49 (Suppl. 1). Available at diabetes.org
- Journal of Clinical Endocrinology and Metabolism: Access peer-reviewed endocrinology and glucose metabolism research.
Medical Disclaimer
This article is for educational purposes only. It does not constitute medical advice, diagnosis, or treatment. Continuous glucose monitoring and blood glucose management are medical topics that may be directly affected by conditions including Type 1 diabetes, Type 2 diabetes, prediabetes, insulinoma, reactive hypoglycemia, and other endocrine disorders, as well as by various medications. The target ranges described in this article are general educational references for healthy adults without diabetes and are not appropriate for individuals with diabetes or metabolic disorders without physician guidance. Always consult a qualified healthcare professional before starting any health monitoring program, making dietary or lifestyle changes in response to glucose readings, or interpreting glucose data for health decisions. Never adjust insulin or other diabetes medications based on CGM readings without physician supervision. In the event of a medical emergency, contact emergency services immediately.

Ganesh G Kamble
Ganesh G. Kamble is the founder and editor of Health is Heaven. He built this site after losing his father to a preventable condition, with the mission of providing clear, trackable health indicators so others can act early. His background is in the IT industry (16 years as an enterprise consultant) and he is not a medical professional; all medical content, formulas, and guides are reviewed by a credentialed medical reviewer/board before publication.