
Medically reviewed by: Health is Heaven Medical Review Board | Published by Ganesh G Kamble, Health is Heaven | Published: April 11, 2026 · Last updated: August 14, 2026
Maintaining tight control over blood glucose is one of the most critical physiological priorities for human health, making it essential to understand normal blood sugar levels chart ranges. The concentration of glucose in the bloodstream is homeostatically regulated to ensure that brain cells, skeletal muscles, and peripheral tissues receive a continuous supply of metabolic fuel (early dysregulation of which manifests as skin signs of insulin resistance on dermal layers), while preventing the systemic damage caused by excessive glycemic exposure. For individuals seeking to understand their metabolic status, a clinical blood sugar level chart provides the benchmark ranges used by clinicians. To help manage your levels, it is essential to understand how to lower blood sugar naturally fast, review healthy recipes for diabetes management, and study the recommended diabetic diet foods to eat and avoid through targeted dietary and lifestyle interventions, allowing endocrinologists to diagnose normal function, prediabetes, and type 1 or type 2 diabetes mellitus.
The standard reference ranges outlined in this guide are based on the clinical practice recommendations established by the American Diabetes Association (ADA) and the World Health Organization (WHO), updated through 2026. When assessing your metabolic health, it is essential to utilize tools such as our free blood sugar checker to evaluate individual readings, and our diabetes risk assessment tool to estimate your probability of insulin resistance. While standard charts focus on fasting and post-meal fingersticks, analyzing your 24-hour glucose curves and target metrics on a normal cgm range for non diabetics guide provides a much more granular view of glycemic variability. Recent 2026 research has further validated the clinical utility of real-time glucose monitoring, demonstrating that individuals with access to continuous glucose data achieve significantly better metabolic outcomes through enhanced pattern recognition and behavior modification. These digital screening tools assist in translating home fingerstick or continuous glucose monitor values into actionable clinical categories, helping you prepare for consultations with your primary care physician or specialist.
Check Your Glycemic Health Instantly
If you have recently tested your blood sugar or received laboratory A1c percentages, use our clinical calculators (found in our directory of free health tools and calculators) to translate your readings and evaluate your long-term metabolic trends.
free blood sugar checker1. Endocrine Glucose Homeostasis: The Insulin-Glucagon Feedback Loop
The human body maintains systemic blood glucose levels within a narrow physiological window, typically between 70 mg/dL and 140 mg/dL, depending on feeding status. This tight regulation is managed by the endocrine pancreas, specifically the islets of Langerhans, which act as a metabolic thermostat (to support this system, you can learn how to lower fasting insulin levels naturally to prevent cellular receptor exhaustion). The two primary counter-regulatory hormones responsible for this dynamic balance are insulin, secreted by beta cells, and glucagon, secreted by alpha cells.
When you consume carbohydrates, the digestive system breaks them down into monosaccharides, primarily glucose, which are absorbed across the intestinal epithelium into the portal circulation. As blood glucose concentration rises, pancreatic beta cells detect this increase via specialized transporter proteins known as glucose transporter 2 (GLUT2) in rodents or glucose transporter 1 (GLUT1) in humans. The entry of glucose into the beta cell initiates a cascade of intracellular biochemical events:
- Glucose Phosphorylation: Once inside the beta cell, glucose is immediately phosphorylated by the enzyme glucokinase (which serves as the glucose sensor for the cell) into glucose-6-phosphate. This step prevents the glucose molecule from exiting the cell and initiates glycolysis.
- Adenosine Triphosphate (ATP) Generation: Glycolysis and subsequent mitochondrial oxidative phosphorylation lead to a significant increase in the intracellular ratio of ATP to adenosine diphosphate (ADP).
- Potassium Channel Closure: The elevated ATP/ADP ratio binds to and closes ATP-sensitive potassium (K-ATP) channels in the cell membrane. This prevents potassium ions from leaving the cell, causing the cell membrane to depolarize.
- Calcium Influx: Membrane depolarization opens voltage-gated L-type calcium channels, allowing extracellular calcium ions to rush into the beta cell.
- Insulin Exocytosis: The rapid increase in intracellular calcium triggers the fusion of insulin-containing secretory vesicles with the cell membrane, releasing insulin into the bloodstream via exocytosis.
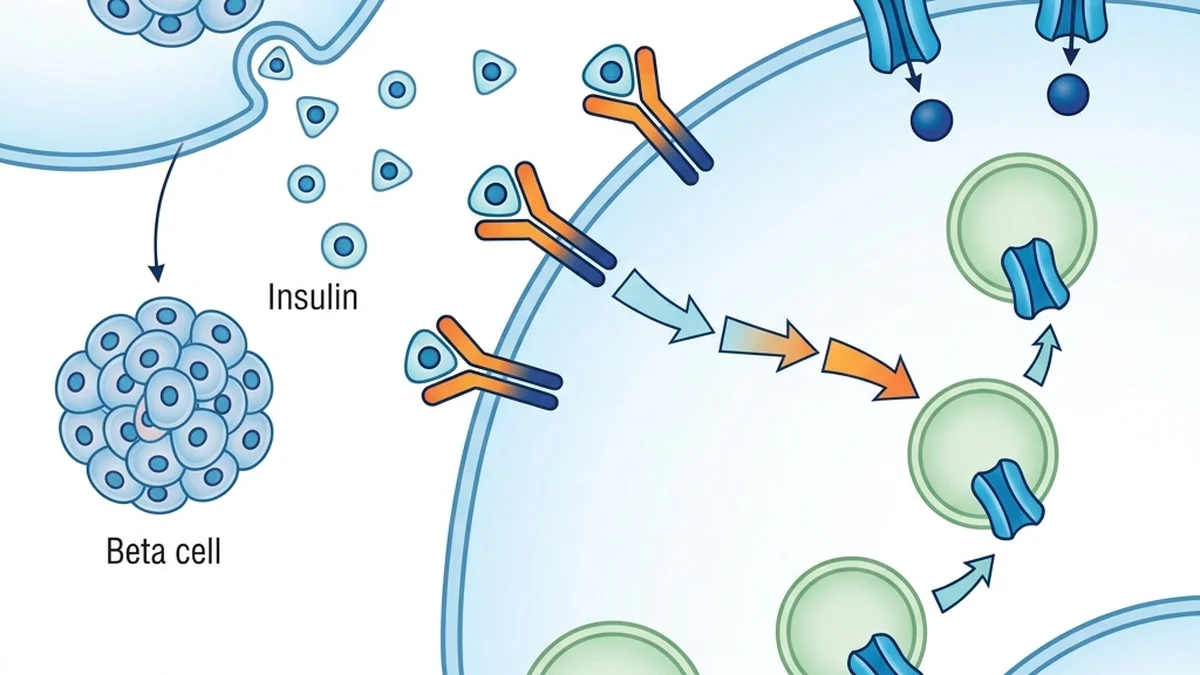
Once released, insulin circulates throughout the body and binds to specific insulin receptors on the surface of target cells, primarily skeletal muscle, adipose tissue, and hepatocytes. Binding triggers the autophosphorylation of the receptor, which recruits insulin receptor substrate (IRS) proteins. This initiates a downstream signaling cascade, specifically the phosphatidylinositol 3-kinase (PI3K) pathway, which promotes the translocation of glucose transporter 4 (GLUT4) vesicles to the cell membrane. GLUT4 serves as the main gateway for glucose entry into muscle and fat cells, effectively lowering circulating blood sugar levels.
Conversely, during periods of fasting or intense exercise, blood glucose levels drop. Pancreatic alpha cells respond to this decline by secreting glucagon. Glucagon travels directly to the liver, where it binds to G-protein coupled receptors on hepatocytes. This activates adenylate cyclase, increasing intracellular cyclic adenosine monophosphate (cAMP) and activating protein kinase A. This pathway stimulates two primary processes: glycogenolysis (the breakdown of stored glycogen into glucose) and gluconeogenesis (the synthesis of glucose from non-carbohydrate precursors like lactate, glycerol, and amino acids). The liver then releases this newly mobilized glucose into the bloodstream to maintain baseline levels and support vital organs.
2. Glycemic Categories: Fasting, Postprandial, and Random Blood Sugar
Clinicians utilize three distinct methods of measuring blood glucose to evaluate metabolic health. Each measurement represents a different facet of insulin sensitivity, hepatic glucose production, and peripheral glucose disposal. Understanding these differences is essential for interpreting clinical charts and diagnostic results.
Fasting Plasma Glucose (FPG)
The fasting plasma glucose test measures blood sugar after a period of complete abstinence from caloric intake for at least 8 hours, typically performed in the morning. FPG is heavily influenced by hepatic glucose output. Under normal conditions, the liver slowly releases glucose overnight to supply the brain. In individuals with insulin resistance, the liver fails to respond to baseline insulin signals, leading to excessive overnight glucose release and elevated morning readings.
Postprandial Glucose (2-Hour Post-Meal)
Postprandial glucose measurements evaluate how effectively the body processes a carbohydrate load. For patients tracking glycemic responses to low-carbohydrate meals, reviewing our ultimate keto diet guide for beginners provides important context on metabolic adaptation. The standard test is the 2-hour Oral Glucose Tolerance Test (OGTT), where a patient drinks a solution containing 75 grams of anhydrous glucose dissolved in water, and blood is drawn two hours later. This test measures the speed of first-phase insulin release and the efficiency of skeletal muscle glucose clearance. Postprandial glucose is often the first metric to become abnormal in early-stage type 2 diabetes.
Random Plasma Glucose (RPG)
A random blood sugar test is conducted at any time of day, regardless of when the last meal was consumed. In healthy individuals, homeostatic mechanisms prevent random blood glucose from spiking excessively. An RPG reading of 200 mg/dL (11.1 mmol/L) or higher, when accompanied by classic symptoms of hyperglycemia (such as polyuria, polydipsia, and unexplained weight loss), is sufficient for a definitive diagnosis of diabetes without requiring repeat testing.
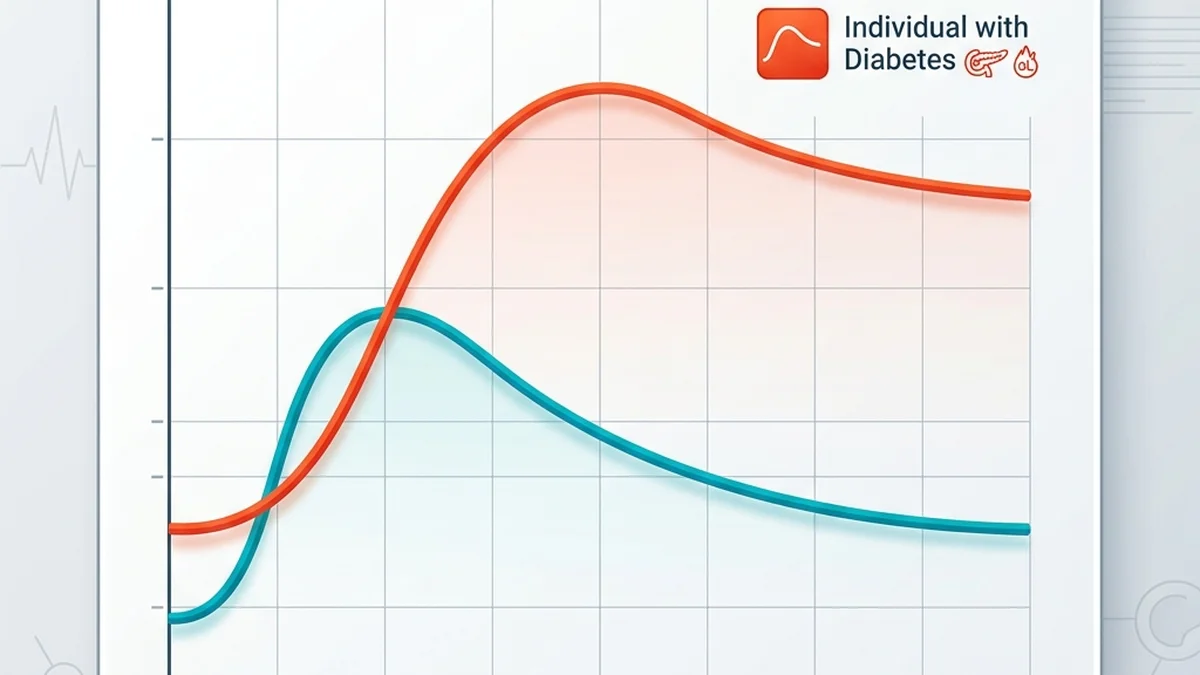
The following table outlines the diagnostic thresholds established by the American Diabetes Association for fasting plasma glucose, post-meal glucose (OGTT), and random plasma glucose. The values are presented in both milligrams per deciliter (mg/dL), the standard unit in the United States, and millimoles per liter (mmol/L), the international metric standard.
| Clinical Category | Fasting Glucose (mg/dL) | Fasting Glucose (mmol/L) | 2-Hour OGTT (mg/dL) | 2-Hour OGTT (mmol/L) | A1C (%) |
|---|---|---|---|---|---|
| Normal | 99 or below | 5.5 or below | 139 or below | 7.7 or below | Below 5.7 |
| Prediabetes | 100 to 125 | 5.6 to 6.9 | 140 to 199 | 7.8 to 11.0 | 5.7 to 6.4 |
| Diabetes | 126 or above | 7.0 or above | 200 or above | 11.1 or above | 6.5 or above |
Random plasma glucose sits outside this grid because it has only one diagnostic cutoff rather than a graded set of bands. A random reading of 200 mg/dL (11.1 mmol/L) or above, taken at any time of day and accompanied by classic hyperglycemia symptoms, is sufficient for diagnosis on its own. Without those symptoms, a single abnormal result on any of these tests is normally confirmed with a repeat test before a diagnosis is recorded.
3. The A1C Test: Your Three-Month Glucose Average
The fasting and post-meal values above are snapshots. Each one describes a single moment, which is why a poor night's sleep or an unusually large dinner can move them. The A1C test describes the whole quarter instead. It measures the percentage of hemoglobin molecules inside your red blood cells that have glucose permanently bonded to them. Because red blood cells survive for roughly three months before being replaced, that percentage reflects cumulative glucose exposure across the preceding two to three months, and a single bad day barely registers.
The A1C diagnostic bands are the ones already listed in the chart above: below 5.7% is normal, 5.7% to 6.4% is prediabetes, and 6.5% or above meets the threshold for diabetes. For people who already carry a diabetes diagnosis, the number to aim for is a different figure entirely. The American Diabetes Association's stated treatment target is an A1C of 7% or less for most people living with diabetes, which sits above the 6.5% diagnostic line rather than below it. That is not a contradiction, and the next section explains why the two kinds of number should never be read off the same row.
Converting A1C to Estimated Average Glucose (eAG)
An A1C percentage is difficult to picture next to a meter reading, because the two are expressed in unrelated units. Estimated average glucose solves this by restating the same A1C result in mg/dL or mmol/L, the units your glucose meter already displays. The conversion below is the American Diabetes Association's published table.
| A1C (%) | Estimated Average Glucose (mg/dL) | Estimated Average Glucose (mmol/L) |
|---|---|---|
| 6.0 | 126 | 7.0 |
| 6.5 | 140 | 7.8 |
| 7.0 | 154 | 8.6 |
| 7.5 | 169 | 9.4 |
| 8.0 | 183 | 10.2 |
| 8.5 | 197 | 10.9 |
| 9.0 | 212 | 11.8 |
| 9.5 | 226 | 12.6 |
| 10.0 | 240 | 13.3 |
The relationship is linear and comes from the A1C-Derived Average Glucose (ADAG) study: eAG in mg/dL = (28.7 × A1C) − 46.7. Divide the mg/dL result by 18 to convert it to mmol/L. Any A1C value not printed in the table above can be calculated this way.
One coincidence in that table causes genuine confusion and is worth pausing on. An A1C of 6.0% converts to an estimated average glucose of 126 mg/dL, which is numerically identical to the fasting threshold for diabetes. These are not the same finding. As a fasting value, 126 mg/dL is one measurement taken after at least eight hours without food. As an eAG, 126 mg/dL is a round-the-clock average spanning three months, blending every post-meal peak with every overnight trough. An A1C of 6.0% falls inside the prediabetes band, not the diabetes band, and matching numbers across the two columns do not carry matching meanings.
4. Does Normal Blood Sugar Change With Age?
This is the single most common question asked about glucose charts, and most charts published online answer it incorrectly. Search for a blood sugar chart by age and you will find tables listing one normal fasting range for children, a slightly higher one for adults in their forties, and a higher one again for people past sixty. Those age brackets are not in the clinical guidelines. They are an invention of content sites, and acting on them can lead someone to dismiss a genuinely abnormal reading as normal for their age.
The diagnostic thresholds do not change with age. A fasting plasma glucose of 126 mg/dL or above, a 2-hour oral glucose tolerance test result of 200 mg/dL or above, or an A1C of 6.5% or above meets the criteria for diabetes at six years old and at eighty-six years old. The NIDDK publishes one set of cutoffs, not an age-graded series. A fasting reading of 115 mg/dL indicates prediabetes at every age; it does not quietly become normal at seventy.
What genuinely does vary is the treatment target, meaning the number a clinician aims for once a person already has a diagnosis. Those targets are individualized, and age is one input among several, alongside pregnancy, type of diabetes, coexisting illness, and vulnerability to hypoglycemia. The distinction is the whole answer to this question: a diagnostic threshold settles whether you have the condition, while a treatment target sets what you are aiming for now that you do. Age moves the second number and leaves the first one alone.
| Situation | What the Number Represents | The Figure |
|---|---|---|
| Anyone being screened, any age | Diagnostic threshold | Identical at every age: fasting 126 mg/dL or above, 2-hour OGTT 200 mg/dL or above, or A1C 6.5% or above (NIDDK) |
| Most non-pregnant adults with diabetes | Treatment target | A1C of 7% or less (ADA) |
| Pregnancy with gestational diabetes | Treatment target | Fasting 95 mg/dL or less; one hour after meals 140 mg/dL or less; two hours after meals 120 mg/dL or less (ADA) |
| Children and adolescents with type 1 diabetes | Treatment target | Individualized by the child's diabetes care team. ADA pediatric goals have been revised toward tighter control as monitoring technology improved (ADA Standards of Care, Section 14) |
| Older adults with diabetes | Treatment target | Individualized by health status rather than age band, and less stringent as coexisting illness and functional or cognitive impairment increase (ADA Standards of Care, Section 13) |
| Low glucose, any age | Safety floor | 70 mg/dL (3.9 mmol/L) or below is low for most people with diabetes (NIDDK) |
Why Older Adults Are Handled Differently
The ADA's Standards of Care sort older adults by health status rather than by age band, grouping them as healthy, complex or intermediate, or very complex and poor health, based on coexisting chronic illness, ability to carry out daily activities, and cognitive status. Targets loosen as that burden rises. The reasoning rests on asymmetric risk. Damage from sustained high glucose accumulates over years, whereas a single severe hypoglycemic episode can cause a fall, a fracture, or a hospital admission within minutes. For a frail eighty-five-year-old, pushing glucose down aggressively can cost more than it returns, so avoiding lows takes precedence over hitting a tight average.
The same logic runs in the opposite direction for children and adolescents with type 1 diabetes. The ADA has revised pediatric goals toward tighter control over the past decade, because continuous glucose monitors and insulin pumps made it possible to hold a lower average without the hypoglycemia rate that once made tight control unsafe in young patients. In both cases the target belongs to the care team rather than to a chart, which is why no specific percentage appears in those two rows above.
5. When Blood Sugar Is Too Low
Glucose charts usually stop at the high end, but the low end carries the more immediate danger. For most people with diabetes, a reading of 70 mg/dL (3.9 mmol/L) or below counts as low, according to the NIDDK. Below that point the brain starts losing its fuel supply and symptoms follow: shakiness, sweating, confusion, irritability, a racing heartbeat, sudden hunger, or difficulty concentrating.
Severe hypoglycemia is defined by what it does rather than by a threshold. It is a low that has progressed to the point where you can no longer treat it yourself and need another person's help, which may involve confusion, seizures, or loss of consciousness. That is a medical emergency and not something to wait out.
Hypoglycemia is far more common in people taking insulin or sulfonylureas than in people managing diabetes through diet or metformin alone, and it is uncommon in people without diabetes at all. If you do not have a diabetes diagnosis and are recording readings below 70 mg/dL, that finding warrants investigation rather than reassurance.
6. When to See a Doctor
Bring any of the following to a clinician rather than resolving it against a chart:
- Any fasting reading of 126 mg/dL (7.0 mmol/L) or above, or any A1C of 6.5% or above. These meet the diagnostic threshold and need laboratory confirmation.
- A random reading of 200 mg/dL (11.1 mmol/L) or above alongside excessive thirst, frequent urination, or unexplained weight loss. With those symptoms present this is urgent rather than routine, and warrants same-day attention.
- Readings anywhere in the prediabetes band (fasting 100 to 125 mg/dL, or A1C 5.7% to 6.4%). This is the stage at which diet, activity, and weight changes alter the outcome most.
- Repeated readings of 70 mg/dL (3.9 mmol/L) or below, whether or not you have a diabetes diagnosis.
- Any low that required another person's help to resolve.
Home meters and the charts on this page are built for tracking and context, not for diagnosis. A diabetes diagnosis rests on laboratory-drawn plasma glucose or a laboratory A1C, and a single abnormal result is normally confirmed by a second test before it is recorded, unless symptoms of marked hyperglycemia are already present. Bring your logged readings to the appointment. A pattern across several weeks tells a clinician considerably more than any single number can.
Frequently Asked Questions
What is a normal blood sugar level?
For someone without diabetes, a normal fasting plasma glucose is 99 mg/dL (5.5 mmol/L) or below, and a normal 2-hour result during an oral glucose tolerance test is 139 mg/dL (7.7 mmol/L) or below. A normal A1C is below 5.7%. These cutoffs are published by the NIDDK and apply at every age.
Is there a blood sugar chart by age?
Not for diagnosis. The thresholds that define normal, prediabetes, and diabetes are identical at every age — a fasting reading of 126 mg/dL or above meets the diabetes criteria whether you are 9 or 90. What does vary by age is the treatment target for people who already have diabetes, which is individualized and generally less stringent for older adults with significant coexisting illness. The age-bracketed normal range charts widely published online are not drawn from the clinical guidelines.
What is a normal blood sugar level 2 hours after eating?
Below 140 mg/dL (7.8 mmol/L). The 140 to 199 mg/dL band is impaired glucose tolerance, a form of prediabetes, and 200 mg/dL (11.1 mmol/L) or above meets the diagnostic threshold for diabetes. These figures refer to the standardized 75-gram oral glucose tolerance test. A reading taken after an ordinary meal is useful for tracking your own patterns but is not a diagnostic test.
What A1C level is considered diabetic?
6.5% or above. Below 5.7% is normal and 5.7% to 6.4% is prediabetes. Note that the diagnostic threshold and the treatment target are two different numbers: 6.5% is where a diagnosis begins, while the American Diabetes Association's target for most people already living with diabetes is 7% or less.
Is a fasting blood sugar of 100 bad?
100 mg/dL is the first value in the prediabetes range, which runs from 100 to 125 mg/dL (5.6 to 6.9 mmol/L). It is not diabetes and it is not an emergency, but it has left the normal band, and it is the stage at which diet, activity, and weight changes have the most leverage on the outcome. A single reading is not a diagnosis and should be repeated.
What is my average blood sugar if my A1C is 7?
Roughly 154 mg/dL (8.6 mmol/L), using the American Diabetes Association's estimated average glucose conversion. That figure is an average across about three months rather than a fasting value, so it blends your overnight lows with your post-meal peaks.
Can an A1C of 6.0% mean I have diabetes?
No. 6.0% falls inside the prediabetes range of 5.7% to 6.4%. The confusion usually comes from the conversion table, where an A1C of 6.0% converts to an estimated average glucose of 126 mg/dL — the same number as the fasting threshold for diabetes. The two measure different things: one is a three-month average, the other a single fasting measurement.
What blood sugar level is dangerous?
At the low end, 70 mg/dL (3.9 mmol/L) or below is considered low for most people with diabetes, and a low severe enough that you cannot treat it yourself is a medical emergency requiring another person's help. At the high end, a random reading of 200 mg/dL (11.1 mmol/L) or above combined with excessive thirst, frequent urination, or unexplained weight loss warrants same-day medical attention rather than a wait-and-see approach.
Scientific References
- National Institute of Diabetes and Digestive and Kidney Diseases. Diabetes Tests & Diagnosis. NIDDK, National Institutes of Health.
- National Institute of Diabetes and Digestive and Kidney Diseases. The A1C Test & Diabetes. NIDDK, National Institutes of Health.
- National Institute of Diabetes and Digestive and Kidney Diseases. Low Blood Glucose (Hypoglycemia). NIDDK, National Institutes of Health.
- American Diabetes Association. Understanding A1C and estimated average glucose. diabetes.org.
- American Diabetes Association. How to Treat Gestational Diabetes. diabetes.org.
- Nathan DM, Kuenen J, Borg R, Zheng H, Schoenfeld D, Heine RJ. Translating the A1C Assay Into Estimated Average Glucose Values (ADAG Study). Diabetes Care. 2008;31(8):1473-1478.
- American Diabetes Association Professional Practice Committee. 13. Older Adults: Standards of Care in Diabetes—2026. Diabetes Care. 2026;49(Supplement 1):S277.
- American Diabetes Association Professional Practice Committee. 14. Children and Adolescents: Standards of Care in Diabetes—2026. Diabetes Care. 2026;49(Supplement 1):S297.

Ganesh G Kamble
Ganesh G. Kamble is the founder and editor of Health is Heaven. He built this site after losing his father to a preventable condition, with the mission of providing clear, trackable health indicators so others can act early. His background is in the IT industry (16 years as an enterprise consultant) and he is not a medical professional; all medical content, formulas, and guides are reviewed by a credentialed medical reviewer/board before publication.